
Page 43 - Revista SPORL - Vol 59. Nº2
P. 43
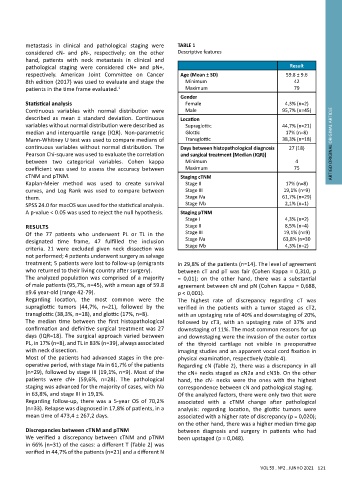
metastasis  in  clinical  and  pathological  staging  were   TABLE 1
          considered  cN-  and  pN-,  respectively;  on  the  other   Descriptive features
          hand,  patients  with  neck  metastasis  in  clinical  and
          pathological  staging  were  considered  cN+  and  pN+,                                Result
          respectively.  American  Joint  Committee  on  Cancer   Age (Mean ± SD)               59.8 ± 9.6
          8th edition (2017) was used to evaluate and stage the       Minimum                      42
          patients in the time frame evaluated. 1                Maximum                           79
                                                             Gender
          Statistical analysis                                   Female                         4,3% (n=2)
          Continuous  variables  with  normal  distribution  were       Male                   95,7% (n=45)
          described  as  mean  ±  standard  deviation.  Continuous   Location
          variables without normal distribution were described as       Supraglottic           44,7% (n=21)
          median and interquartile range (IQR). Non-parametric       Glottic                    17% (n=8)
          Mann-Whitney U test was used to compare medians of       Transglottic                38,3% (n=18)
          continuous variables without normal distribution. The   Days between histopathological diagnosis  27 (18)      ARTIGO ORIGINAL ORIGINAL ARTICLE
          Pearson Chi-square was used to evaluate the correlation   and surgical treatment [Median (IQR)]
          between  two  categorical  variables.  Cohen  kappa       Minimum                        4
          coefficient  was  used  to  assess  the  accuracy  between       Maximum                 75
          cTNM and pTNM.                                     Staging cTNM
          Kaplan-Meier  method  was  used  to  create  survival       Stage II                  17% (n=8)
          curves,  and  Log  Rank  was  used  to  compare  between       Stage III             19,1% (n=9)
          them.                                                  Stage IVa                     61,7% (n=29)
          SPSS 24.0 for macOS was used for the statistical analysis.       Stage IVb            2,1% (n=1)
          A p-value < 0.05 was used to reject the null hypothesis.  Staging pTNM
                                                                 Stage I                        4,3% (n=2)
          RESULTS                                                Stage II                       8,5% (n=4)
          Of  the  77  patients  who  underwent  PL  or  TL  in  the       Stage III           19,1% (n=9)
          designated  time  frame,  47  fulfilled  the  inclusion       Stage IVa              63,8% (n=30
          criteria.  21  were  excluded  given  neck  dissection  was       Stage IVb           4,3% (n=2)
          not performed; 4 patients underwent surgery as salvage
          treatment; 5 patients were lost to follow-up (emigrants   in 29,8% of the patients (n=14). The level of agreement
          who returned to their living country after surgery).   between cT and pT was fair (Cohen Kappa = 0,310, p
          The analyzed population was comprised of a majority   =  0,01);  on  the  other  hand,  there  was  a  substantial
          of male patients (95,7%, n=45), with a mean age of 59.8   agreement between cN and pN (Cohen Kappa = 0,688,
          ±9.6 year-old (range 42-79).                      p < 0,001).
          Regarding  location,  the  most  common  were  the   The  highest  rate  of  discrepancy  regarding  cT  was
          supraglottic  tumors  (44,7%,  n=21),  followed  by  the   verified  in  the  patients  with  a  tumor  staged  as  cT2,
          transglottic (38,3%, n=18), and glottic (17%, n=8).  with an upstaging rate of 40% and downstaging of 20%,
          The  median  time  between  the  first  histopathological   followed  by  cT3,  with  an  upstaging  rate  of  37%  and
          confirmation and definitive surgical treatment was 27   downstaging of 11%. The most common reasons for up
          days  (IQR=18).  The  surgical  approach  varied  between   and downstaging were the invasion of the outer cortex
          PL, in 17% (n=8), and TL in 83% (n=39), always associated   of  the  thyroid  cartilage  not  visible  in  preoperative
          with neck dissection.                             imaging studies and an apparent vocal cord fixation in
          Most of the patients had advanced stages in the pre-  physical examination, respectively (table 4).
          operative period, with stage IVa in 61,7% of the patients   Regarding cN (Table 2), there was a discrepancy in all
          (n=29), followed by stage III (19,1%, n=9). Most of the   the cN+ necks staged as cN2a and cN3b. On the other
          patients  were  cN+  (59,6%,  n=28).  The  pathological   hand,  the  cN-  necks  were  the  ones  with  the  highest
          staging was advanced for the majority of cases, with IVa   correspondence between cN and pathological staging.
          in 63,8%, and stage III in 19,1%.                 Of the analyzed factors, there were only two that were
          Regarding  follow-up,  there  was  a  5-year  OS  of  70,2%   associated  with  a  cTNM  change  after  pathological
          (n=33). Relapse was diagnosed in 17,8% of patients, in a   analysis:  regarding  location,  the  glottic  tumors  were
          mean time of 473,4 ± 267,2 days.                  associated with a higher rate of discrepancy (p = 0,020);
                                                            on the other hand, there was a higher median time gap
          Discrepancies between cTNM and pTNM               between  diagnosis  and  surgery  in  patients  who  had
          We  verified  a  discrepancy  between  cTNM  and  pTNM   been upstaged (p = 0,048).
          in 66% (n=31) of the cases: a different T (Table 2) was
          verified in 44,7% of the patients (n=21) and a different N


                                                                                       VOL 59 . Nº2 . JUNHO 2021 121