


Page 44 - Portuguese Journal - SPORL - Vol 61. Nº1
P. 44
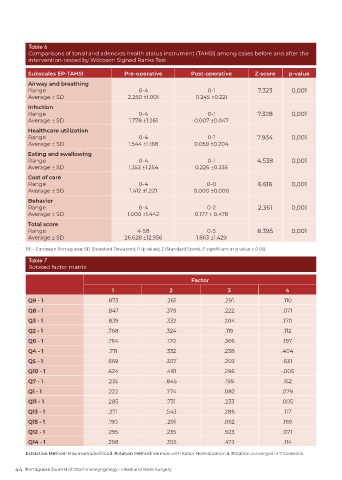
Table 6
          Comparisons of tonsil and adenoids health status instrument (TAHSI) among cases before and after the
          intervention-tested by Wilcoxon Signed Ranks Test
          Subscales EP-TAHSI              Pre-operative         Post-operative        Z-score    p-value
          Airway and breathing
          Range                                0-4                    0-1             7.323       0,001
          Average ± SD                     2.250 ±1.001           0.245 ±0.221
          Infection
          Range                                0-4                    0-1             7.328       0,001
          Average ± SD                      1.778 ±1.261         0.007 ±0.047
          Healthcare utilization
          Range                                0-4                    0-1             7.934       0,001
          Average ± SD                      1.544 ±1.168         0.059 ±0.204
          Eating and swallowing
          Range                                0-4                    0-1             4.538       0,001
          Average ± SD                      1.353 ±1.254          0.226 ±0.336
          Cost of care
          Range                                0-4                    0-0              6.616      0,001
          Average ± SD                      1.412 ±1.221         0.000 ±0.000
          Behavior
          Range                                0-4                    0-2              2.361      0,001
          Average ± SD                     1.000 ±1.442           0.177 ± 0.478
          Total score
          Range                                4-58                   0-5             8.395       0,001
          Average ± SD                    26.628 ±12.956          1.863 ±1.429

          EP – European Portuguese; SD (Standard Deviation); P (p value); Z (Standard Score). (* significant at p value ≤ 0.05).
          Table 7
          Rotated factor matrix

                                                                Factor
                                      1                  2                  3                   4
          Q9 - 1                     .873               .261               .291                .110
          Q8 - 1                     .847               .379               .222                .071

          Q3 - 1                     .839               .332               .204                .170
          Q2 - 1                     .768               .324                .119               .112
          Q6 - 1                     .764               .170               .366                .197
          Q4 - 1                     .711               .332               .238               .404
          Q5 - 1                     .669               .307               .203                .631
          Q10 - 1                    .624               .481               .296               -.005
          Q7 - 1                     .235               .845               .199                .152
          Q1 - 1                     .222               .774               .082               .079
          Q11 - 1                    .285               .731               .233               .005
          Q13 - 1                    .271               .543               .286                .117
          Q15 - 1                    .190               .291               .062                .169
          Q12 - 1                    .295               .235               .923                .071
          Q14 - 1                    .298               .305               .473                .114

          Extraction Method: Maximum Likelihood. Rotation Method: Varimax with Kaiser Normalization a. Rotation converged in 7 iterations.

      44  Portuguese Journal of Otorhinolaryngology - Head and Neck Surgery

