


Page 43 - Portuguese Journal - SPORL - Vol 61. Nº1
P. 43
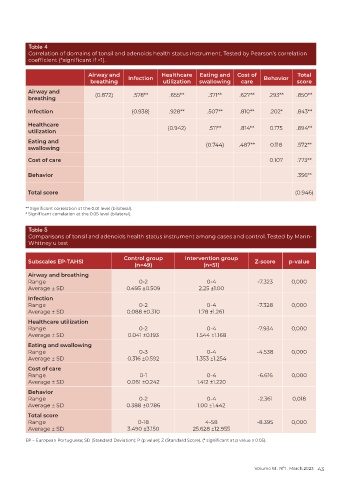
Table 4
          Correlation of domains of tonsil and adenoids health status instrument. Tested by Pearson’s correlation
          coefficient (*significant if <1).

                              Airway and               Healthcare  Eating and   Cost of             Total
                                            Infection                                   Behavior
                               breathing               utilization  swallowing   care              score
          Airway and             (0.872)     .578**      .655**       .371**    .627**    .293**   .850**
          breathing
          Infection                          (0.938)     .928**       .507**     .810**   .202*    .843**

          Healthcare
          utilization                                    (0.942)      .511**     .814**   0.175    .894**
          Eating and                                                 (0.744)    .487**     0.118   .572**
          swallowing
          Cost of care                                                                    0.107    .773**

          Behavior                                                                                 .356**


          Total score                                                                              (0.946)

          ** Significant correlation at the 0.01 level (bilateral).
          * Significant correlation at the 0.05 level (bilateral).

          Table 5
          Comparisons of tonsil and adenoids health status instrument among cases and control. Tested by Mann-
          Whitney u test

                                          Control group       Intervention group
          Subscales EP-TAHSI                                                          Z-score    p-value
                                              (n=49)                (n=51)
          Airway and breathing
          Range                                0-2                    0-4             -7.323      0,000
          Average ± SD                     0.495 ±0.509            2.25 ±1.00
          Infection
          Range                                0-2                    0-4             -7.328      0,000
          Average ± SD                     0.088 ±0.310            1.78 ±1.261
          Healthcare utilization
          Range                                0-2                    0-4             -7.934      0,000
          Average ± SD                     0.041 ±0.193           1.544 ±1.168
          Eating and swallowing
          Range                                0-3                    0-4             -4.538      0,000
          Average ± SD                     0.316 ±0.592           1.353 ±1.254
          Cost of care
          Range                                0-1                    0-4             -6.616      0,000
          Average ± SD                     0.061 ±0.242           1.412 ±1.220
          Behavior
          Range                                0-2                    0-4              -2.361     0,018
          Average ± SD                     0.388 ±0.786           1.00 ±1.442
          Total score
          Range                                0-18                  4-58             -8.395      0,000
          Average ± SD                     3.490 ±3.150          25.628 ±12.955
          EP – European Portuguese; SD (Standard Deviation); P (p value); Z (Standard Score). (* significant at p value ≤ 0.05).


                                                                                     Volume 61 . Nº1 . March 2023 43

