


Page 42 - Portuguese Journal - SPORL - Vol 61. Nº1
P. 42
adaptation and translation of the original        done  Pearson’s  correlation  coefficient.  (Table
          English study tool. The parents of the children   4). The reliability coefficient was adequate at
          filled the questionnaire without any trouble, in   ƴ = 0.9.
          a short time (4.5 ± 1.8 min).
                                                            Validity:  The  comparison  between  the  first
          Demographic results: The first group included     group (control group) and the second group
          the patients who underwent tonsillectomy or       (intervention group, before the operation) was
          adenotonsillectomy - 51 patients, while the       performed, using the Mann-Whitney U test. It
          control group included 49 children. The final     showed a significant difference between the
          number of participants was 100 children.          2 groups: the total score in the first group was
          (Table 2)                                         3.490  ±3.150 (0-18);  in the  second  group was
                                                            25.628 ±12.955 (4-58). (P-value <0.001) (Table 5).
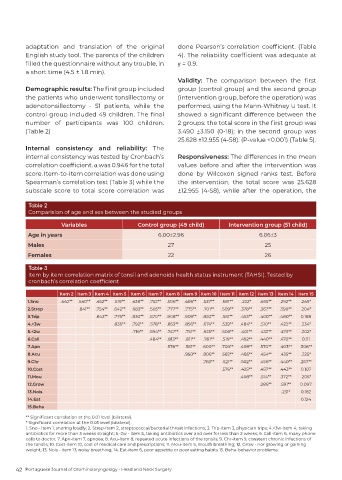
          Internal consistency and reliability: The
          internal consistency was tested by Cronbach’s     Responsiveness: The differences in the mean
          correlation coefficient. α was 0.946 for the total   values before and after the intervention was
          score. Item-to-item correlation was done using    done  by  Wilcoxon  signed  ranks  test.  Before
          Spearman’s correlation test (Table 3) while the   the intervention, the total score was 25.628
          subscale  score  to  total  score  correlation  was   ±12.955  (4-58),  while  after  the  operation,  the


          Table 2
          Comparision of age and sex between the studied groups

                     Variables                 Control group (49 child)      Intervention group (51 child)
          Age in years                               6.00±2.96                         6.06±3
          Males                                          27                              25
          Females                                        22                              26

          Table 3
          Item by item correlation matrix of tonsil and adenoids health status instrument (TAHSI). Tested by
          cronbach’s correlation coefficient

                     Item 2 Item 3 Item 4 Item 5  Item 6 Item 7 Item 8 Item 9 Item 10 Item 11 Item 12 Item 13  Item 14  Item 15
          1.Sno      .442**  .540**  .452**  .519**  .438**  .752**  .506**  .486**  .537**  .681**  .222*  .465**  .292**  .249*
          2.Strep          .841**  .754**  .642**  .683**  .505**  .777**  .775**  .701**  .509**  .378**  .367**  .390**  .204*
          3.Trip                 .843**  .775**  .830**  .570**  .908**  .909**  .820**  .561**  .453**  .400**  .480**  0.188
          4.>3w                        .836**  .792**  .578**  .853**  .856**  .674**  .539**  .484**  .510**  .422**  .234*
          5.<2w                              .716**  .594**  .747**  .751**  .625**  .506**  .401**  .432**  .473**  .202*
          6.Call                                  .484**  .813**  .811**  .781**  .519**  .492**  .440**  .470**  0.111
          7.Apn                                         .578**  .561**  .600**  .709**  .408**  .570**  .403**  .308**
          8.Acu                                               .950**  .806**  .582**  .485**  .454**  .435**  .225*
          9.Chr                                                     .783**  .521**  .502**  .456**  .440**  .257**
          10.Cost                                                          .576**  .425**  .457**  .443**  0.107
          11.Mou                                                                 .408**  .514**  .372**  .205*
          12.Grow                                                                      .286**  .591**  0.097
          13.Nois                                                                             .231*  0.182
          14.Eat                                                                                     0.124
          15.Beha
          ** Significant correlation at the 0.01 level (bilateral).
          * Significant correlation at the 0.05 level (bilateral).
          1. Sno - item 1, snoring loudly; 2. Strep-item 2, streptococcal/bacterial throat infections; 3. Trip-item 3, physician trips; 4.>3w-item 4, taking
          antibiotics for more than 3 weeks straight; 5.-2w - item 5, taking antibiotics over and over for less than 2 weeks; 6. Call-item 6, many phone
          calls to doctor; 7. Apn-item 7, apnoea; 8. Acu-item 8, repeated acute infections of the tonsils; 9. Chr-item 9, constant chronic infections of
          the tonsils; 10. Cost-item 10, cost of medical care and prescriptions; 11. Mou-item 5, mouth breathing; 12. Grow - nor growing or gaining
          weight; 13. Nois - item 13, noisy breathing; 14. Eat-item 6, poor appetite or poor eating habits 15. Beha-behavior problems.


      42  Portuguese Journal of Otorhinolaryngology - Head and Neck Surgery

