


Page 36 - Portuguese Journal - SPORL - Vol 61. Nº1
P. 36
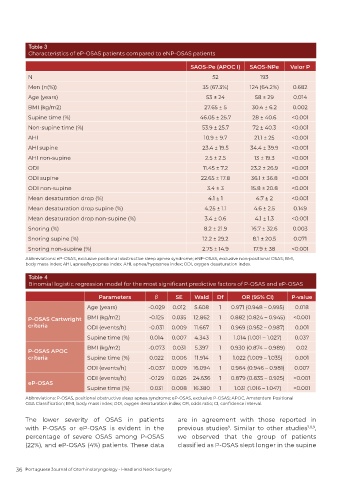
Table 3
          Characteristics of eP-OSAS patients compared to eNP-OSAS patients

                                                                SAOS-Pe (APOC I)    SAOS-NPe     Valor P
          N                                                            52              193
          Men (n(%))                                                35 (67.3%)      124 (64.2%)   0.682
          Age (years)                                                53 ± 24          58 ± 29     0.014
          BMI (kg/m2)                                                27.65 ± 5       30.4 ± 6.2   0.002

          Supine time (%)                                          46.05 ± 25.7      28 ± 40.6    <0.001
          Non-supine time (%)                                       53.9 ± 25.7      72 ± 40.3    <0.001
          AHI                                                        10.9 ± 9.7      21.1 ± 25    <0.001
          AHI supine                                                23.4 ± 19.5     34.4 ± 39.9   <0.001
          AHI non-supine                                             2.5 ± 2.5       13 ± 19.3    <0.001
          ODI                                                       11.45 ± 7.2     23.2 ± 26.9   <0.001
          ODI supine                                                22.65 ± 17.8    36.1 ± 36.8   <0.001
          ODI non-supine                                              3.4 ± 3       15.8 ± 20.8   <0.001
          Mean desaturation drop (%)                                  4.1 ± 1         4.7 ± 2     <0.001
          Mean desaturation drop supine (%)                          4.25 ± 1.1      4.6 ± 2.5    0.149
          Mean desaturation drop non-supine (%)                      3.4 ± 0.6        4.1 ± 1.3   <0.001
          Snoring (%)                                                8.2 ± 21.9     16.7 ± 32.6   0.003
          Snoring supine (%)                                        12.2 ± 29.2      8.1 ± 20.5   0.071

          Snoring non-supine (%)                                    2.75 ± 14.9      17.9 ± 38    <0.001
          Abbreviations: eP-OSAS, exclusive positional obstructive sleep apnea syndrome; eNP-OSAS, exclusive non-positional OSAS; BMI,
          body mass index; AHI, apnea/hypopnea index; AHI, apnea/hypopnea index; ODI, oxygen desaturation index.

          Table 4
          Binomial logistic regression model for the most significant predictive factors of P-OSAS and eP-OSAS

                                  Parameters        β      SE    Wald    Df      OR (95% CI)      P-value
                              Age (years)         -0.029  0.012  5.608    1   0.971 (0.948 – 0.995)  0.018
          P-OSAS Cartwright   BMI (kg/m2)         -0.125  0.035  12.862   1  0.882 (0.824 – 0.945)  <0.001
          criteria            ODI (events/h)      -0.031  0.009  11.667   1   0.969 (0.952 – 0.987)  0.001

                              Supine time (%)      0.014  0.007  4.343    1    1.014 (1.001 – 1.027)  0.037
                              BMI (kg/m2)         -0.073  0.031   5.397   1  0.930 (0.874 – 0.989)  0.02
          P-OSAS APOC
          criteria            Supine time (%)      0.022  0.006   11.914  1   1.022 (1.009 – 1.035)  0.001
                              ODI (events/h)      -0.037  0.009  16.094   1   0.964 (0.946 – 0.981)  0.007
                              ODI (events/h)      -0.129  0.026  24.636   1   0.879 (0.835 – 0.925)  <0.001
          eP-OSAS
                              Supine time (%)      0.031  0.008  16.380   1    1.031 (1.016 – 1.047)  <0.001

          Abbreviations: P-OSAS, positional obstructive sleep apnea syndrome; eP-OSAS, exclusive P-OSAS; APOC, Amsterdam Positional
          OSA Classification; BMI, body mass index; ODI, oxygen desaturation index; OR, odds ratio; CI, confidence interval.

         The lower severity of OSAS in patients             are in agreement with those reported in
         with P-OSAS or eP-OSAS is evident in the           previous studies . Similar to other studies 7,8,9 ,
                                                                             9
         percentage of severe OSAS among P-OSAS             we observed that the group of patients
         (22%), and eP-OSAS (4%) patients. These data       classified as P-OSAS slept longer in the supine


      36  Portuguese Journal of Otorhinolaryngology - Head and Neck Surgery

