


Page 35 - Portuguese Journal - SPORL - Vol 61. Nº1
P. 35
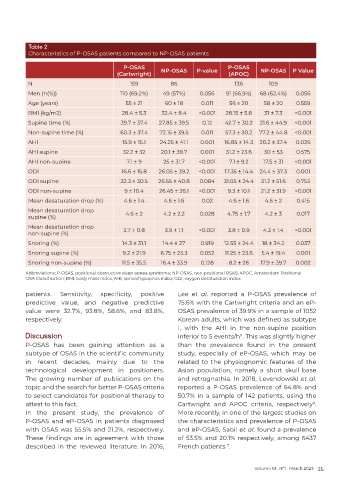
Table 2
          Characteristics of P-OSAS patients compared to NP-OSAS patients

                                          P-OSAS                             P-OSAS
                                        (Cartwright)  NP-OSAS     P-value    (APOC)    NP-OSAS    P Value
          N                                 159           86                   136        109
          Men (n(%))                     110 (69.2%)   49 (57%)    0.056    91 (66.9%)  68 (62.4%)  0.056
          Age (years)                      55 ± 21      60 ± 18     0.011    56 ± 20    58 ± 20    0.559

          BMI (kg/m2)                    28.4 ± 5.3    32.4 ± 8.4  <0.001   28.15 ± 5.8  31 ± 7.3  <0.001
          Supine time (%)                39.7 ± 37.4  27.85 ± 39.5  0.12    42.7 ± 30.2  21.6 ± 44.9  <0.001
          Non-supine time (%)            60.3 ± 37.4  72.15 ± 39.5  0.011   57.3 ± 30.2  77.2 ± 44.8  <0.001
          AHI                             15.9 ± 15.1  24.25 ± 41.1  0.001  16.85 ± 14.3  20.2 ± 37.4  0.026
          AHI supine                      32.2 ± 32   20.1 ± 39.7  0.001    31.2 ± 23.6  30 ± 53   0.575
          AHI non-supine                   7.1 ± 9     25 ± 31.7   <0.001    7.1 ± 9.2  17.5 ± 31  <0.001
          ODI                            16.6 ± 15.8  26.05 ± 39.2  <0.001  17.35 ± 14.4  24.4 ± 37.3  0.001
          ODI supine                     32.3 ± 30.5  26.55 ± 40.8  0.084  31.05 ± 24.4  31.2 ± 51.6  0.753
          ODI non-supine                  9 ± 10.4    26.45 ± 36.1  <0.001   9.3 ± 10.1  21.2 ± 31.9  <0.001
          Mean desaturation drop (%)      4.6 ± 1.4    4.6 ± 1.6    0.02     4.6 ± 1.6   4.6 ± 2   0.415
          Mean desaturation drop
          supine (%)                       4.6 ± 2     4.2 ± 2.2   0.028    4.75 ± 1.7   4.2 ± 3   0.017
          Mean desaturation drop
          non-supine (%)                  3.7 ± 0.8     3.9 ± 1.1  <0.001    3.8 ± 0.9  4.3 ± 1.4  <0.001
          Snoring (%)                     14.3 ± 31.1  14.4 ± 27    0.919  12.55 ± 24.4  18 ± 34.2  0.037
          Snoring supine (%)              9.2 ± 21.9  6.75 ± 23.3  0.052    11.25 ± 23.6  5.4 ± 19.4  0.001
          Snoring non-supine (%)         11.5 ± 35.5  16.4 ± 33.9   0.128    8.2 ± 26  17.9 ± 39.7  0.002
          Abbreviations: P-OSAS, positional obstructive sleep apnea syndrome; NP-OSAS, non-positional OSAS; APOC, Amsterdam Positional
          OSA Classification; BMI, body mass index; AHI, apnea/hypopnea index; ODI, oxygen desaturation index.

          patients.   Sensitivity,   specificity,   positive   Lee  et al. reported a P-OSAS prevalence of
          predictive value, and negative predictive         75.6% with the Cartwright criteria and an eP-
          value were 32.7%, 93.8%, 58.6%, and 83.8%,        OSAS prevalence of 39.9% in a sample of 1052
          respectively.                                     Korean adults, which was defined as subtype
                                                            I, with the AHI in the non-supine position
          Discussion                                        inferior to 5 events/h . This was slightly higher
                                                                                 11
          P-OSAS has been gaining attention as a            than the prevalence found in the present
          subtype of OSAS in the scientific community       study, especially of eP-OSAS, which may be
          in recent decades, mainly due to the              related to the physiognomic features of the
          technological development in positioners.         Asian population, namely a short skull base
          The growing number of publications on the         and retrognathia. In 2018, Levendowski et al.
          topic and the search for better P-OSAS criteria   reported a P-OSAS prevalence of 64.8% and
          to select candidates for positional therapy to    50.7%  in  a  sample  of  142  patients,  using  the
          attest to this fact.                              Cartwright  and APOC  criteria,  respectively .
                                                                                                         9
          In the present study, the prevalence of           More recently, in one of the largest studies on
          P-OSAS and eP-OSAS in patients diagnosed          the characteristics and prevalence of P-OSAS
          with OSAS was 55.5% and 21.2%, respectively.      and eP-OSAS, Sabil et al. found a prevalence
          These  findings  are  in  agreement  with  those   of 53.5% and 20.1% respectively, among 6437
          described in the reviewed literature. In 2016,    French patients  .
                                                                            7


                                                                                     Volume 61 . Nº1 . March 2023 35

