


Page 34 - Portuguese Journal - SPORL - Vol 61. Nº1
P. 34
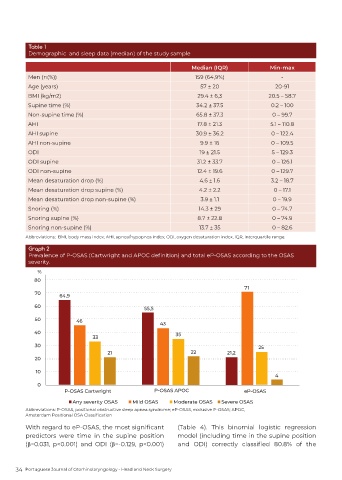
Table 1
          Demographic  and sleep data (median) of the study sample

                                                                 Median (IQR)              Min-max
          Men (n(%))                                              159 (64,9%)                 -
          Age (years)                                              57 ± 20                  20-91
          BMI (kg/m2)                                              29.4 ± 6,3             20.5 – 58.7
          Supine time (%)                                         34.2 ± 37.5              0.2 – 100
          Non-supine time (%)                                     65.8 ± 37.3              0 – 99.7
          AHI                                                     17.8 ± 21.3              5.1 – 110.8
          AHI supine                                              30.9 ± 36.2              0 – 122.4
          AHI non-supine                                           9.9 ± 16                0 – 109.5
          ODI                                                      19 ± 21.5               5 – 129.3
          ODI supine                                              31.2 ± 33.7              0 – 126.1
          ODI non-supine                                          12.4 ± 19.6              0 – 129.7
          Mean desaturation drop (%)                               4.6 ± 1.6               3.2 – 18.7
          Mean desaturation drop supine (%)                        4.2 ± 2.2                0 – 17.1
          Mean desaturation drop non-supine (%)                     3.9 ± 1.1              0 – 19.9
          Snoring (%)                                              14.3 ± 29               0 – 74.7
          Snoring supine (%)                                      8.7 ± 22.8               0 – 74.9
          Snoring non-supine (%)                                   13.7 ± 35               0 – 82.6
          Abbreviations:  BMI, body mass index; AHI, apnea/hypopnea index; ODI, oxygen desaturation index, IQR, interquartile range.

          Graph 2
          Prevalence of P-OSAS (Cartwright and APOC definition) and total eP-OSAS according to the OSAS
          severity.


          Abbreviations: P-OSAS, positional obstructive sleep apnea syndrome; eP-OSAS, exclusive P-OSAS; APOC,
          Amsterdam Positional OSA Classification
          With regard to eP-OSAS, the most significant      (Table 4). This binomial logistic regression
          predictors were time in the supine position       model (including time in the supine position
          (β=0.031, p<0.001) and ODI (β=-0.129, p<0.001)    and  ODI)  correctly  classified  80.8%  of  the


      34  Portuguese Journal of Otorhinolaryngology - Head and Neck Surgery

