


Page 33 - Portuguese Journal - SPORL - Vol 61. Nº1
P. 33
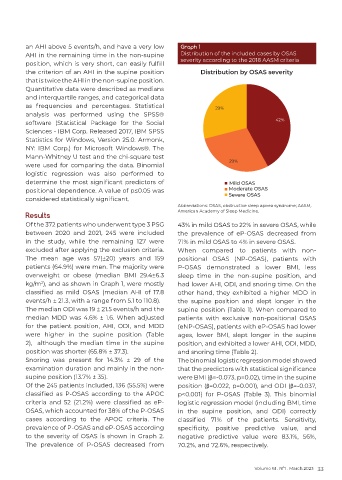
an AHI above 5 events/h, and have a very low       Graph 1
          AHI in the remaining time in the non-supine        Distribution of the included cases by OSAS
                                                             severity according to the 2018 AASM criteria
          position, which is very short, can easily fulfill
          the criterion of an AHI in the supine position
          that is twice the AHI in the non-supine position.
          Quantitative data were described as medians
          and interquartile ranges, and categorical data
          as frequencies and percentages. Statistical
          analysis was performed using the SPSS®
          software (Statistical Package for the Social
          Sciences - IBM Corp. Released 2017, IBM SPSS
          Statistics for Windows, Version 25.0. Armonk,
          NY: IBM Corp.) for Microsoft Windows®. The
          Mann-Whitney U test and the chi-square test
          were used for comparing the data. Binomial
          logistic  regression  was also  performed  to
          determine the most significant predictors of
          positional dependence. A value of p≤0.05 was
          considered statistically significant.
                                                            Abbreviations: OSAS, obstructive sleep apnea syndrome; AASM,
                                                            American Academy of Sleep Medicine.
          Results
          Of the 372 patients who underwent type 3 PSG      43% in mild OSAS to 22% in severe OSAS, while
          between 2020 and 2021, 245 were included          the prevalence of eP-OSAS decreased from
          in the study, while the remaining 127 were        71% in mild OSAS to 4% in severe OSAS.
          excluded after applying the exclusion criteria.   When compared to patients with non-
          The mean age was 57(±20) years and 159            positional OSAS (NP-OSAS), patients with
          patients (64.9%) were men. The majority were      P-OSAS demonstrated a lower BMI, less
          overweight or obese (median BMI 29.4±6.3          sleep time in the non-supine position, and
          kg/m ), and as shown in Graph 1, were mostly      had lower AHI, ODI, and snoring time. On the
               2
          classified  as  mild  OSAS  (median  AHI  of  17.8   other hand, they exhibited a higher MDD in
          events/h ± 21.3, with a range from 5.1 to 110.8).  the supine position and slept longer in the
          The median ODI was 19 ± 21.5 events/h and the     supine position (Table 1). When compared to
          median MDD was 4.6% ± 1.6. When adjusted          patients with exclusive non-positional OSAS
          for the patient position, AHI, ODI, and MDD       (eNP-OSAS), patients with eP-OSAS had lower
          were higher in the supine position (Table         ages, lower BMI, slept longer in the supine
          2),  although the median time in the supine       position, and exhibited a lower AHI, ODI, MDD,
          position was shorter (65.8% ± 37.3).              and snoring time (Table 2).
          Snoring was present  for 14.3% ± 29 of the        The binomial logistic regression model showed
          examination duration and mainly in the non-       that the predictors with statistical significance
          supine position (13.7% ± 35).                     were BMI (β=-0.073, p=0.02), time in the supine
          Of the 245 patients included, 136 (55.5%) were    position (β=0.022, p=0.001), and ODI (β=-0.037,
          classified  as  P-OSAS  according  to  the  APOC   p<0.001) for P-OSAS (Table 3). This binomial
          criteria  and  52  (21.2%)  were  classified  as  eP-  logistic regression model (including BMI, time
          OSAS, which accounted for 38% of the P-OSAS       in the supine position, and ODI) correctly
          cases according to the APOC criteria. The         classified  71%  of  the  patients.  Sensitivity,
          prevalence of P-OSAS and eP-OSAS according        specificity,  positive  predictive  value,  and
          to the severity of OSAS is shown in Graph 2.      negative predictive value were 83.1%, 56%,
          The prevalence of P-OSAS decreased from           70.2%, and 72.6%, respectively.


                                                                                     Volume 61 . Nº1 . March 2023 33

