
Page 63 - Revista Portuguesa - SPORL - Vol 63. Nº2
P. 63
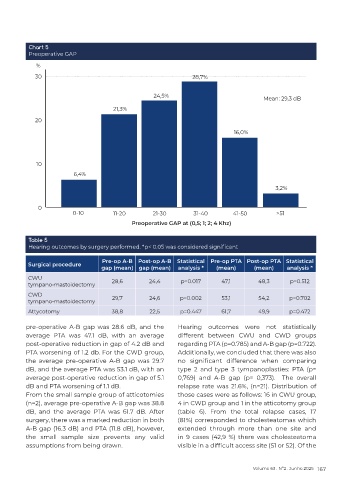
Chart 5
           Preoperative GAP


          Table 5
          Hearing outcomes by surgery performed. *p< 0.05 was considered significant

                                   Pre-op A-B  Post-op A-B  Statistical  Pre-op PTA Post-op PTA Statistical
          Surgical procedure
                                   gap (mean) gap (mean)    analysis *   (mean)      (mean)     analysis *
          CWU                         28,6        24,4       p=0.017      47,1         48,3      p=0.512
          tympano-mastoidectomy
          CWD
          tympano-mastoidectomy       29,7         24,6      p=0.002      53,1         54,2      p=0.702
          Attycotomy                  38,8         22,5      p=0.447      61,7         49,9      p=0.472

          pre-operative A-B gap was 28.6 dB, and the        Hearing outcomes were not statistically
          average PTA was 47.1 dB, with an average          different between CWU and CWD groups
          post-operative reduction in gap of 4.2 dB and     regarding PTA (p=0.785) and A-B gap (p=0.722).
          PTA worsening of 1.2 db. For the CWD group,       Additionally, we concluded that there was also
          the average pre-operative A-B gap was 29.7        no  significant  difference  when  comparing
          dB, and the average PTA was 53.1 dB, with an      type  2  and type  3  tympanoplasties:  PTA  (p=
          average post-operative reduction in gap of 5.1    0,769)  and  A-B  gap  (p=  0,373).    The  overall
          dB and PTA worsening of 1.1 dB.                   relapse rate was 21.6%, (n=21). Distribution of
          From the small sample group of atticotomies       those cases were as follows: 16 in CWU group,
          (n=2), average pre-operative A-B gap was 38.8     4 in CWD group and 1 in the atticotomy group
          dB, and the average PTA was 61.7 dB. After        (table 6). From the total relapse cases, 17
          surgery, there was a marked reduction in both     (81%) corresponded to cholesteatomas which
          A-B gap (16.3 dB) and PTA (11.8 dB), however,     extended through more than one site and
          the  small sample size  prevents any valid        in  9 cases  (42,9  %)  there  was cholesteatoma
          assumptions from being drawn.                     visible in a difficult access site (S1 or S2). Of the


                                                                                     Volume 63 . Nº2 . Junho 2025 167