
Page 32 - Portuguese Journal - SPORL - Vol 61. Nº2
P. 32
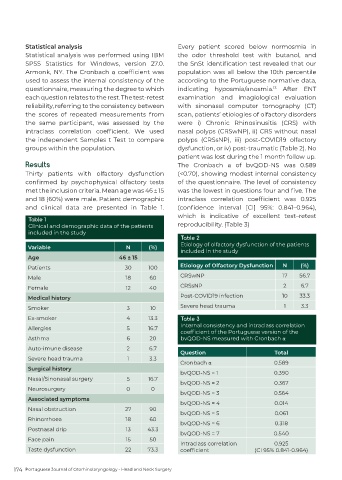
Statistical analysis                               Every patient scored below normosmia in
         Statistical analysis was performed using IBM       the odor threshold test with butanol, and
         SPSS  Statistics  for  Windows,  version  27.0.    the SnSt identification test revealed that our
         Armonk, NY. The Cronbach α coefficient was         population was all below the 10th percentile
         used to assess the internal consistency of the     according to the Portuguese normative data,
         questionnaire, measuring the degree to which       indicating hyposmia/anosmia.  After ENT
                                                                                            13
         each question relates to the rest. The test-retest   examination and imagiological evaluation
         reliability, referring to the consistency between   with sinonasal computer tomography (CT)
         the scores of repeated measurements from           scan, patients’ etiologies of olfactory disorders
         the same participant, was assessed by the          were i) Chronic Rhinosinusitis (CRS) with
         intraclass  correlation  coefficient.  We  used    nasal polyps (CRSwNP), ii) CRS without nasal
         the independent Samples t Test to compare          polyps (CRSsNP), iii) post-COVID19 olfactory
         groups within the population.                      dysfunction, or iv) post-traumatic (Table 2). No
                                                            patient was lost during the 1 month follow up.
         Results                                            The Cronbach  α of bvQOD-NS was 0.589
         Thirty patients with olfactory dysfunction         (<0.70), showing modest internal consistency
         confirmed  by  psychophysical  olfactory  tests    of the questionnaire. The level of consistency
         met the inclusion criteria. Mean age was 46 ± 15   was the lowest in questions four and five. The
         and 18 (60%) were male. Patient demographic        intraclass  correlation  coefficient  was  0.925
         and clinical data are presented in Table 1.        (confidence  interval  [CI]  95%:  0.841–0.964),
                                                            which is indicative of excellent test–retest
          Table 1
          Clinical and demographic data of the patients     reproducibility. (Table 3)
          included in the study
                                                             Table 2
                                                             Etiology of olfactory dysfunction of the patients
          Variable                         N      (%)
                                                             included in the study
          Age                           46 ± 15
          Patients                        30      100        Etiology of Olfactory Dysfunction  N    (%)

          Male                             18      60        CRSwNP                            17   56.7
          Female                           12      40        CRSsNP                            2     6.7
          Medical history                                    Post-COVID19 infection            10   33.3
          Smoker                           3       10        Severe head trauma                1     3.3
          Ex-smoker                        4      13.3       Table 3
                                                             Internal consistency and intraclass correlation
          Allergies                        5      16.7
                                                             coefficient of the Portuguese version of the
          Asthma                           6       20        bvQOD-NS measured with Cronbach α
          Auto-imune disease               2      6.7
                                                             Question                       Total
          Severe head trauma               1       3.3
                                                             Cronbach α                     0.589
          Surgical history
                                                             bvQOD-NS = 1                   0.390
          Nasal/Sinonasal surgery          5      16.7
                                                             bvQOD-NS = 2                   0.367
          Neurosurgery                     0       0
                                                             bvQOD-NS = 3                   0.564
          Associated symptoms
                                                             bvQOD-NS = 4                   0.014
          Nasal obstruction                27      90
                                                             bvQOD-NS = 5                   0.061
          Rhinorrhoea                      18      60
                                                             bvQOD-NS = 6                   0.318
          Postnasal drip                   13     43.3
                                                             bvQOD-NS = 7                   0.540
          Face pain                        15      50
                                                             Intraclass correlation         0.925
          Taste dysfunction                22     73.3       coefficient             (CI 95% 0.841-0.964)


      174  Portuguese Journal of Otorhinolaryngology - Head and Neck Surgery