
Page 36 - Revista SPORL - Vol 58. Nº1
P. 36
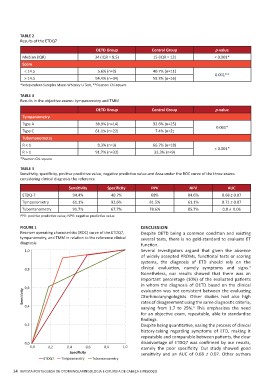
TABLE 2
Results of the ETDQ7

                                   OETD Group                   Control Group         p-value
                                                                15 (IQR = 13)         < 0.001*
Median (IQR)                       34 (IQR = 8.5)
                                                                40.7% (n=11)          0.001**
Score                                                           59.3% (n=16)

< 14.5                             5.6% (n=2)

> 14.5                             94.4% (n=34)

*Independent-Samples Mann-Whitney U Test, **Pearson Chi-square

TABLE 3
Results in the objective exams: tympanometry and TMM

 Tympanometry                      OETD Group                   Control Group         p-value
 Type A                                                                                0.001*
 Type C                            38.9% (n=14)                 92.6% (n=25)          < 0.001*
 Tubomanometry                     61.1% (n=22)                   7.4% (n=2)
 R<1
 R>1                                8.3% (n=3)                  66.7% (n=18)
*Pearson Chi-square                91.7% (n=33)                  33.3% (n=9)

TABLE 4
Sensitivity, specificity, positive predictive value, negative predictive value and Area-under the ROC curve of the three exams
considering clinical diagnosis the reference

                      Sensitivity  Specificity                   PPV            NPV       AUC
                                                                 68%           84.6%  0.68 ± 0.07
ETDQ-7                94.4%        40.7%                        81.5%          61.1%  0.71 ± 0.07
                                                                78.6%          85.7%  0.8 ± 0.06
Tympanometry          61.1%        92.6%

Tubomanometry         91.7%        67.7%

PPV: positive predictive value; NPV: negative predictive value

FIGURE 1                                                        DISCUSSION
Receiver operating characteristic (ROC) curve of the ETDQ7,     Despite OETD being a common condition and existing
tympanometry, and TMM in relation to the reference clinical     several tests, there is no gold-standard to evaluate ET
diagnosis                                                       function.
                                                                Several investigators argued that given the absence
                                                                of widely accepted PROMs, functional tests or scoring
                                                                systems, the diagnosis of ETD should rely on the
                                                                clinical evaluation, namely symptoms and signs.4
                                                                Nonetheless, our results showed that there was an
                                                                important percentage (10%) of the evaluated patients
                                                                in whom the diagnosis of OETD based on the clinical
                                                                evaluation was not consistent between the evaluating
                                                                Otorhinolaryngologists. Other studies had also high
                                                                rates of disagreement using the same diagnostic criteria,
                                                                varying from 1.7 to 25%.6 This emphasizes the need
                                                                for an objective exam, repeatable, able to standardize
                                                                findings.
                                                                Despite being quantitative, easing the process of clinical
                                                                history-taking regarding symptoms of ETD, making it
                                                                repeatable and comparable between patients, the clear
                                                                disadvantage of ETDQ7 was confirmed by our results,
                                                                namely the poor specificity. Our study showed good
                                                                sensitivity and an AUC of 0.68 ± 0.07. Other authors

34 REVISTA PORTUGUESA DE OTORRINOLARINGOLOGIA E CIRURGIA DE CABEÇA E PESCOÇO