
Page 35 - Revista SPORL - Vol 58. Nº1
P. 35
considered compatible with ETD.5 The patients from Demographic features ARTIGO ORIGINAL ORIGINAL ARTICLE
the group with ETD were instructed to answer the The median age of the patients in the OETD group was
questionnaire regarding the diseased ear. 52.5 (IQR = 23.75) years old and 47 (IQR = 24) in the
- Tympanometry on both ears. It was classified as C type control group, with no significant difference between
if middle ear (ME) pressure < - 100 daPa. In the group the two (p = 0.091). Both the OETD group and the control
with OETD the result on the affected ear was considered; group had a female predominance, with no significant
in the control group the right ear was considered for difference in what gender concerns (p = 0.769).
analysis purposes.
- Tubomanometry (TMM): it was performed at 300daPa, ETDQ-7 results
400daPa, and 500daPa on both sides. It was defined as We found a significant difference in the score of ETDQ7
normal if R < 1 in all the evaluated pressures; compatible between patients from the OETD group and the control
with OETD when R > 1 in one of the tested pressures. In group, with a median of 34 (IQR = 8.5) in the former and
the group with OETD the ET on the side of the affected 15 (IQR = 13) in the latter (p < 0.001).
ear was considered; in the control group the right side Most patients in the ETD group had a score > 14.5;
ET was considered for analysis purposes. nonetheless, a high percentage of patients in the control
group also had a score compatible with ETD.
Statistical analysis
Continuous variables without normal distribution were Objective tests
described as median and interquartile range (IQR). We found a significant difference in the results of
Non-parametric Mann-Whitney U Test was used to tympanometry and TMM in both groups (p = 0.001 and
compare medians of continuous variables without p < 0.001, respectively).
normal distribution. The Pearson Chi-square was used
to evaluate the correlation between two categorical Correlation between the three tests
variables. The Pearson correlation coefficient was used Our results showed a moderate correlation between
to assess the strength of a linear association between the objective exams used, namely tympanometry and
two categorical variables and was denoted by r. TMM [r (63) = 0.49, p = 0.001]; on the other hand, the
ETDQ7 and objective tests (tympanometry and TMM) correlation between ETDQ7 and tympanometry and
were analyzed as index tests, in relation to reference between ETDQ7 and TMM were weak [r (63) = 0.283, p
clinical diagnosis, and sensitivity, specificity, PPV, and = 0.025 and r (63) = 0.388, p = 0.002, respectively].
NPV were calculated for the three. Receiver operating
characteristic (ROC) curves were calculated, and area- Sensitivity, specificity, positive and negative predictive
under the ROC curve (AUC) was used to compare them. value of ETDQ7, tympanometry, and TMM
SPSS v24.0 for macOS was used for statistical analysis. A Using a clinical diagnosis as reference for OETD
p-value < 0.05 was defined to reject the null hypothesis. diagnosis, our results showed that ETDQ7 had the
highest sensitivity of the three (94.4%); TMM had also
RESULTS a high sensitivity, of 91.7%; tympanometry was the
A total of 40 patients were initially selected for the least sensitive of the three (61.1%). On the other hand,
cohort of patients with symptoms of OETD. They were tympanometry had the highest specificity (92.6%),
further evaluated by three Otorhinolaryngologists: followed by TMM (67.7%) and ETDQ7 (40.7%).
there was complete agreement in the diagnosis of OETD Overall, TMM had a good AUC, of 0.8 ± 0.06,
in 36 of them (90%), which comprised the final cohort tympanometry a fair AUC (0.71 ± 0.07) and a poor AUC
of the OETD group. for ETDQ7 (0.68 ± 0.07) (Figure 1).
A total of 30 patients were selected to the control
group. 3 were excluded for difficulties in completing all
the evaluation protocol.
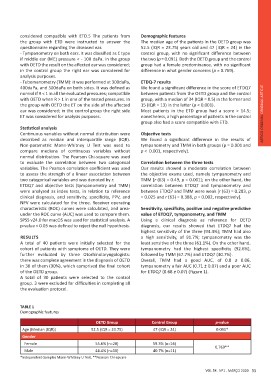
TABLE 1
Demographic features
OETD Group Control Group p-value
47 (IQR = 24) 0.091*
Age (Median (IQR)) 52.5 (IQR = 23.75) 0.769**
59.3% (n=16)
Gender 40.7% (n=11) VOL 58 . Nº1 . MARÇO 2020 33
Female 55.6% (n=20)
Male 44.4% (n=16)
*Independent-Samples Mann-Whitney U Test, **Pearson Chi-square