
Page 81 - Revista Portuguesa - SPORL - Vol 62. Nº1
P. 81
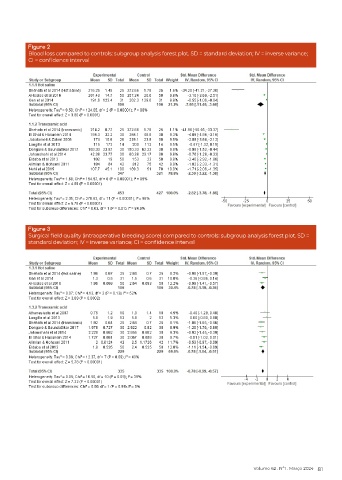
Figure 2
          Blood loss compared to controls: subgroup analysis forest plot. SD = standard deviation; IV = inverse variance;
          CI = confidence interval


          Figure 3
          Surgical field quality (intraoperative bleeding score) compared to controls: subgroup analysis forest plot. SD =
          standard deviation; IV = inverse variance; CI = confidence interval


                                                                                     Volume 62 . Nº1 . Março 2024 81