
Page 11 - Revista Portuguesa - SPORL - Vol 61. Nº4
P. 11
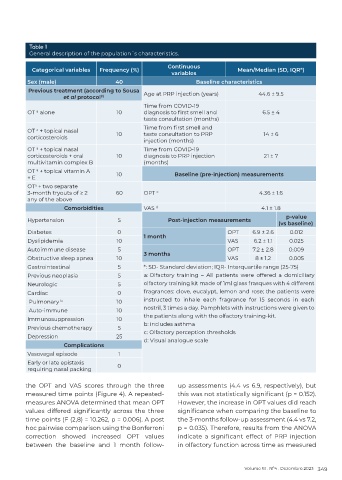
Table 1
           General description of the population´s characteristics.

                                                         Continuous
            Categorical variables  Frequency (%)                                Mean/Median (SD, IQR*)
                                                          variables
          Sex (male)                   40                         Baseline characteristics
          Previous treatment (according to Sousa   Age at PRP injection (years)        44.6 ± 9.5
                      et al protocol (1)
                                                 Time from COVID-19
          OT   alone                    10       diagnosis to first smell and           6.5 ± 4
             a
                                                 taste consultation (months)
                                                 Time from first smell and
          OT   + topical nasal
             a
          corticosteroids               10       taste consultation to PRP              14 ± 6
                                                 injection (months)
          OT   + topical nasal                   Time from COVID-19
             a
          corticosteroids + oral        10       diagnosis to PRP injection              21 ± 7
          multivitamin complex B                 (months)
          OT   + topical vitamin A      10                 Baseline (pre-injection) measurements
             a
          + E
          OT  + two separate
             a
          3-month tryouts of ≥ 2       60        OPT                                   4.36 ± 1.6
                                                     c
          any of the above
                      Comorbidities              VAS  d                                 4.1 ± 1.8
          Hypertension                  5                Post-injection measurements            p-value
                                                                                             (vs baseline)
          Diabetes                      0        1 month                    OPT      6.9 ± 2.6   0.012
          Dyslipidemia                  10                                  VAS      6.2 ± 1.1   0.025
          Autoimmune disease            5        3 months                   OPT      7.2 ± 2.8   0.009
          Obstructive sleep apnea       10                                  VAS       8 ± 1.2    0.005
          Gastrointestinal              5        *: SD- Standard deviation; IQR- Interquartile range (25-75)
          Previous neoplasia            5        a: Olfactory training – All patients were offered a domiciliary

          Neurologic                    5        olfactory training kit made of 1ml glass frasques with 4 different
          Cardiac                       0        fragrances: clove, eucalypt, lemon and rose; the patients were
           Pulmonary  b                 10       instructed to inhale each fragrance for 15 seconds in each
           Auto-immune                  10       nostril, 3 times a day. Pamphlets with instructions were given to
          Immunosuppression             10       the patients along with the olfactory training-kit.
          Previous chemotherapy         5        b: includes asthma
                                                 c: Olfactory perception thresholds
          Depression                    25       d: Visual analogue scale
                      Complications
          Vasovagal episode             1
          Early or late epistaxis       0
          requiring nasal packing

          the OPT and VAS scores through the three          up assessments (4.4 vs 6.9, respectively), but
          measured time points (Figure 4). A repeated-      this was not statistically significant (p = 0.152).
          measures ANOVA determined that mean OPT           However, the increase in OPT values did reach
          values  differed  significantly  across  the  three   significance when comparing the baseline to
          time points (F (2,8) = 10.262, p = 0.006). A post   the 3-months follow-up assessment (4.4 vs 7.2,
          hoc pairwise comparison using the Bonferroni      p = 0.035). Therefore, results from the ANOVA
          correction showed increased OPT values            indicate  a  significant  effect  of  PRP  injection
          between the baseline and 1 month follow-          in olfactory function across time as measured


                                                                                  Volume 61 . Nº4 . Dezembro 2023 349